Free and Easy Analytics with Elastic Stack
Now we are talking about Infrastructure Analytics.
Elastic is a tool that can ingest any (and I mean it, any!) kind of information from multiple sources, correlate them all together, and create some beautiful and fully customizable dashboards.
To give you an idea of what you can achieve, I will show a couple of use cases that I discovered while exploring the tool.
Automation chatbots code insights
While doing integration tests of my chatbot automation project and going through logs manually, I found that it just didn’t scale and was inefficient in time and precision.
So, “What if I recode to logging in JSON format and read it from Elastic? I might be able to see graphically what is happening at each stage, inputs, outcomes, etc”
The results were amazing.
Usually, it’s hard to show how much automation can help you, to give a number, or something that can clearly influence a decision, or to even view how your code is performing and what users are doing with it.
Check this dashboard. The difference between the “Automated Requests” vs “Tasks Executed”, that number (ratio 1:3) should give you an idea of how much time and precision you are winning with automation.
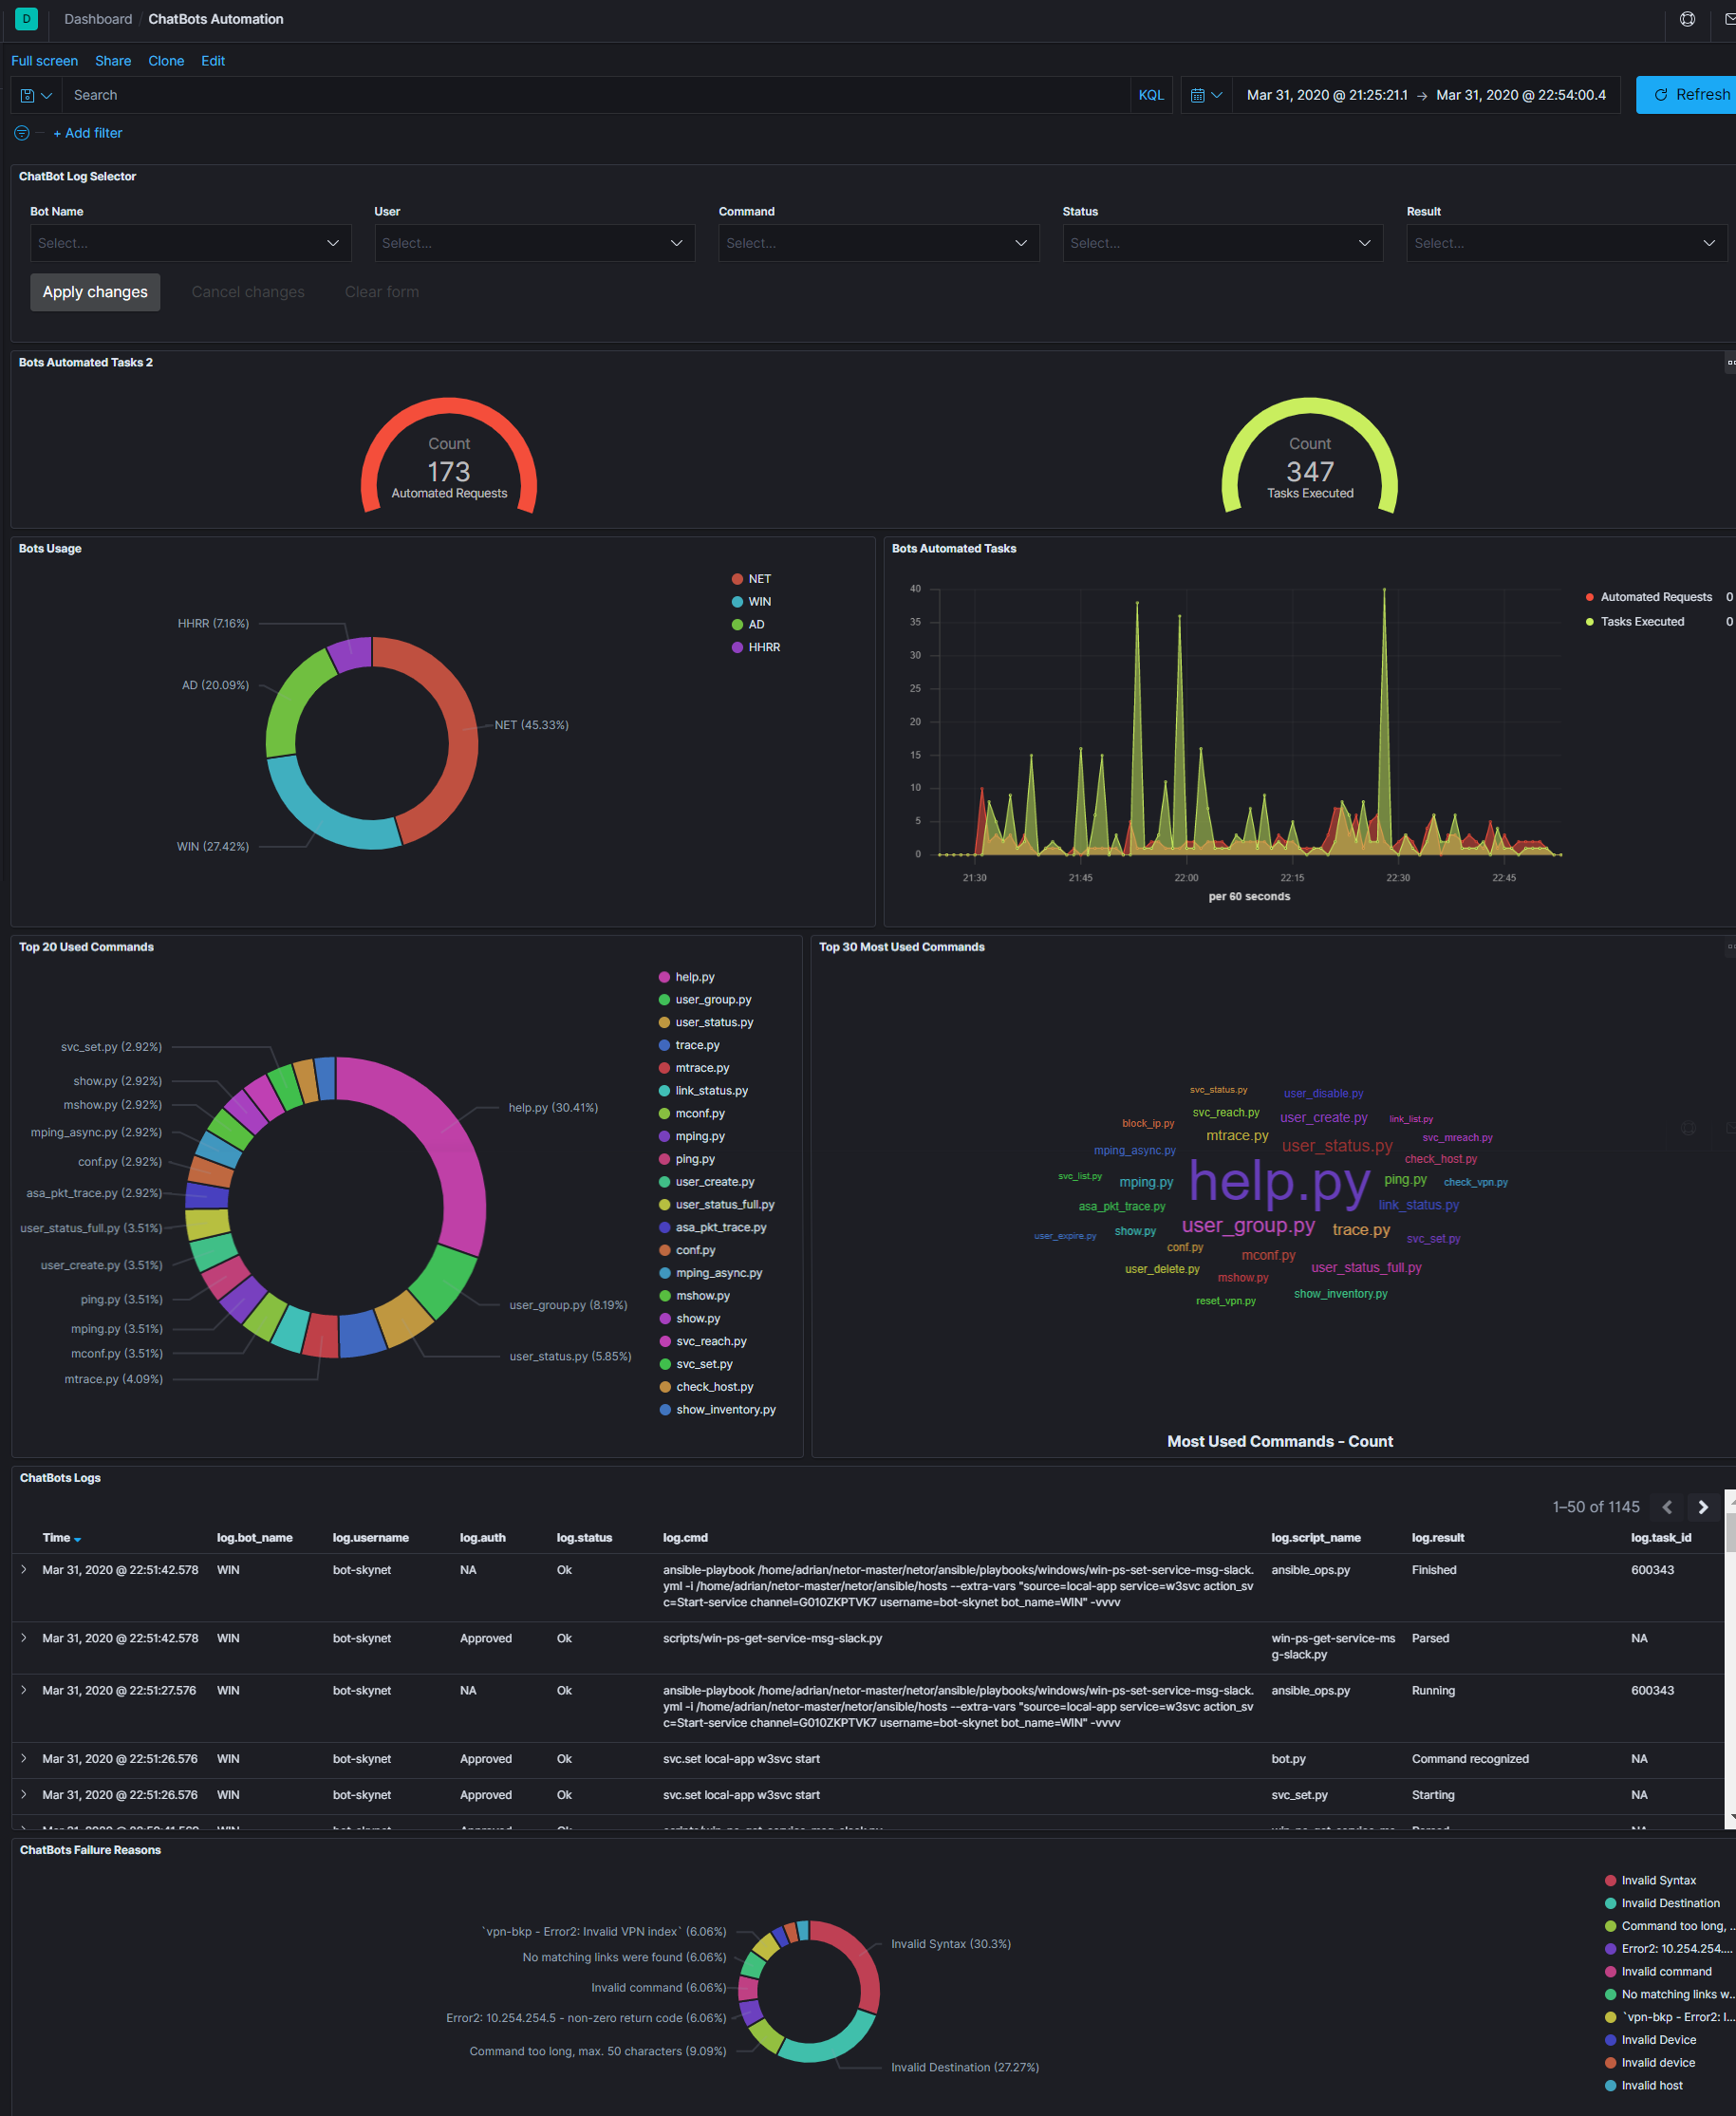
You can also see on the same screen: How much each bot is being used, when, which commands are the most used, a raw log with the execution details, most common errors, and of course at the top of the dashboard a selector to filter the information if you are looking for something specific.
Network logs
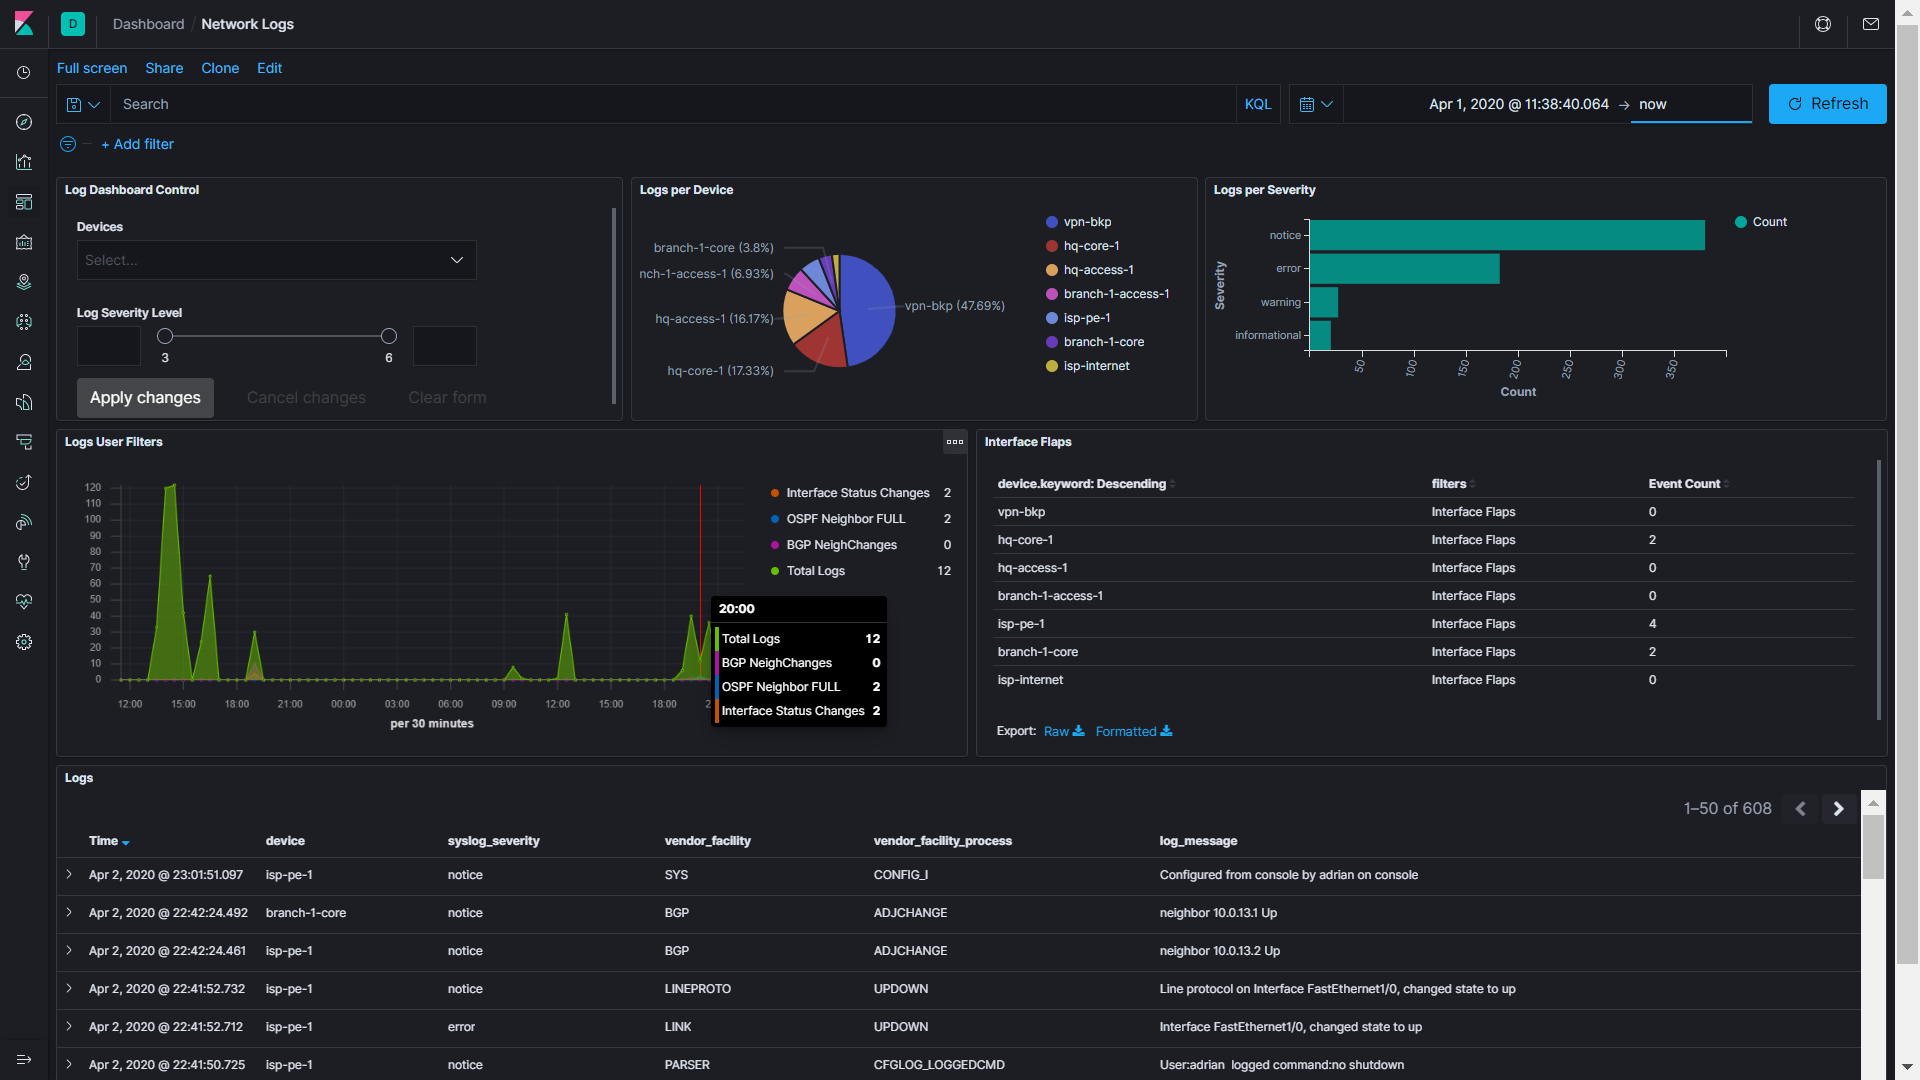
This next dashboard is a creation of David Flores (thank you for this great tutorial), look at the amount of information you can have by only sending the network device syslogs to Elastic. Please take 2 minutes to read it.
It has filters, timeline, interface flaps, events for routing changes, and configuration audits just in case that someone has been doing some change at that moment.
Now, let’s move on to the next one. I’m getting excited!
Netflow traffic search
For years I’ve tried to find an easy and productive way of using Netflow, tried OpenSource and Commercial tools. None was good enough for my requirements.
This beauty has arrived, check this next dashboard.
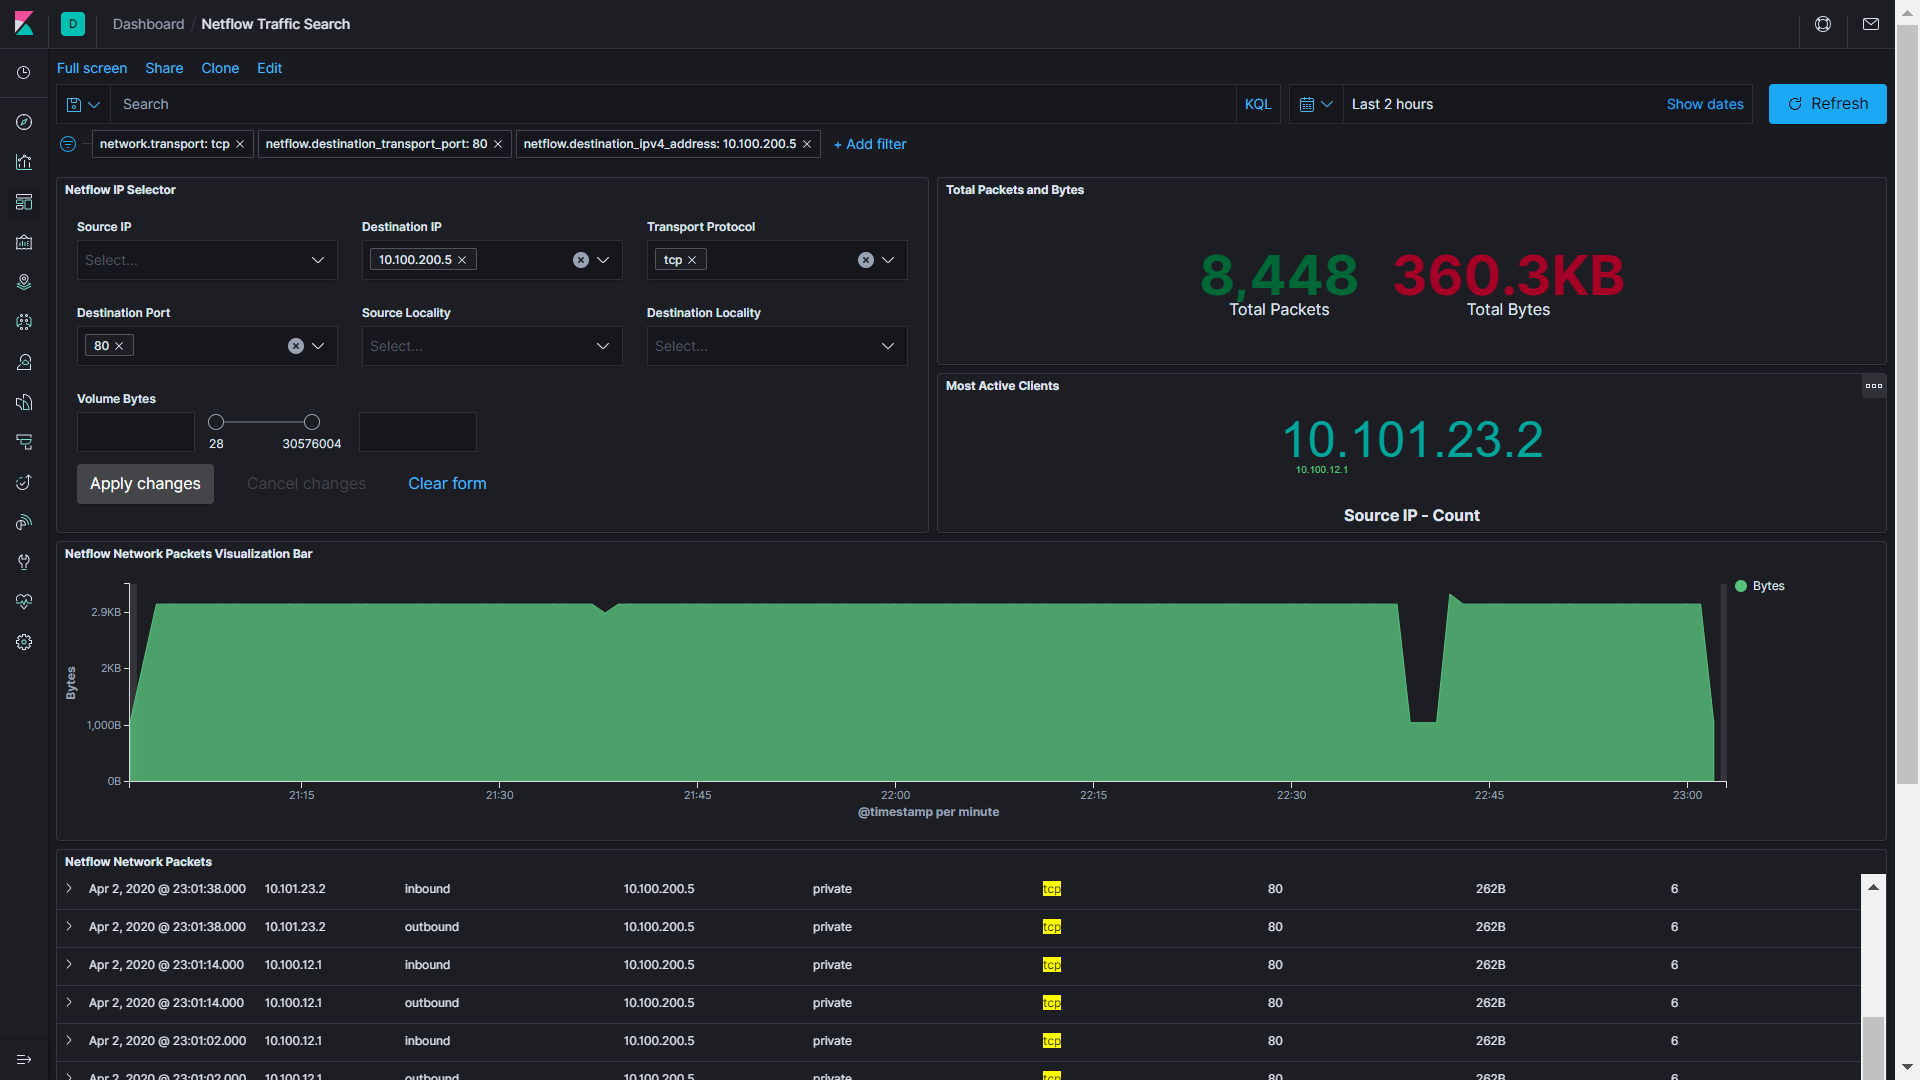
You can see the overall traffic and all of those charts that are usually useless. But since this is fully customizable, I will show you a better one.
With a selector and given an IP or protocol, you can find information about anything, in this case, volume in bytes. So if you need to know about a specific issue in a flow or just out of curiosity, you can find it in your network.
Here, I’m showing an interruption of transfer that I provoked for the creation of this graph.
Good for now? The next one blows my mind. Yes, Elastic ingest anything and you can correlate everything on one screen.
Trace an issue from the network perspective
Forget about when there is an incident and you have to gather all the engineers in a room so they can show one by one their tools, and try to find mutual understanding.
On one screen you can have all the information to potentially help find the problem.
You will see a traffic interruption again, in this case, I proked 3 kinds of errors for showing purposes.
The graph shows the conversation partners, the traffic interruption in volume (bytes), the events in the network related to configuration changes or normal ones when a peer goes down, which I also provoked by turning down an interface. And finally, I also added a route to null.
You can check it out in the log below. But wait, there is more. What if the Web server service is down? Check the Windows Log, you will see that event too.
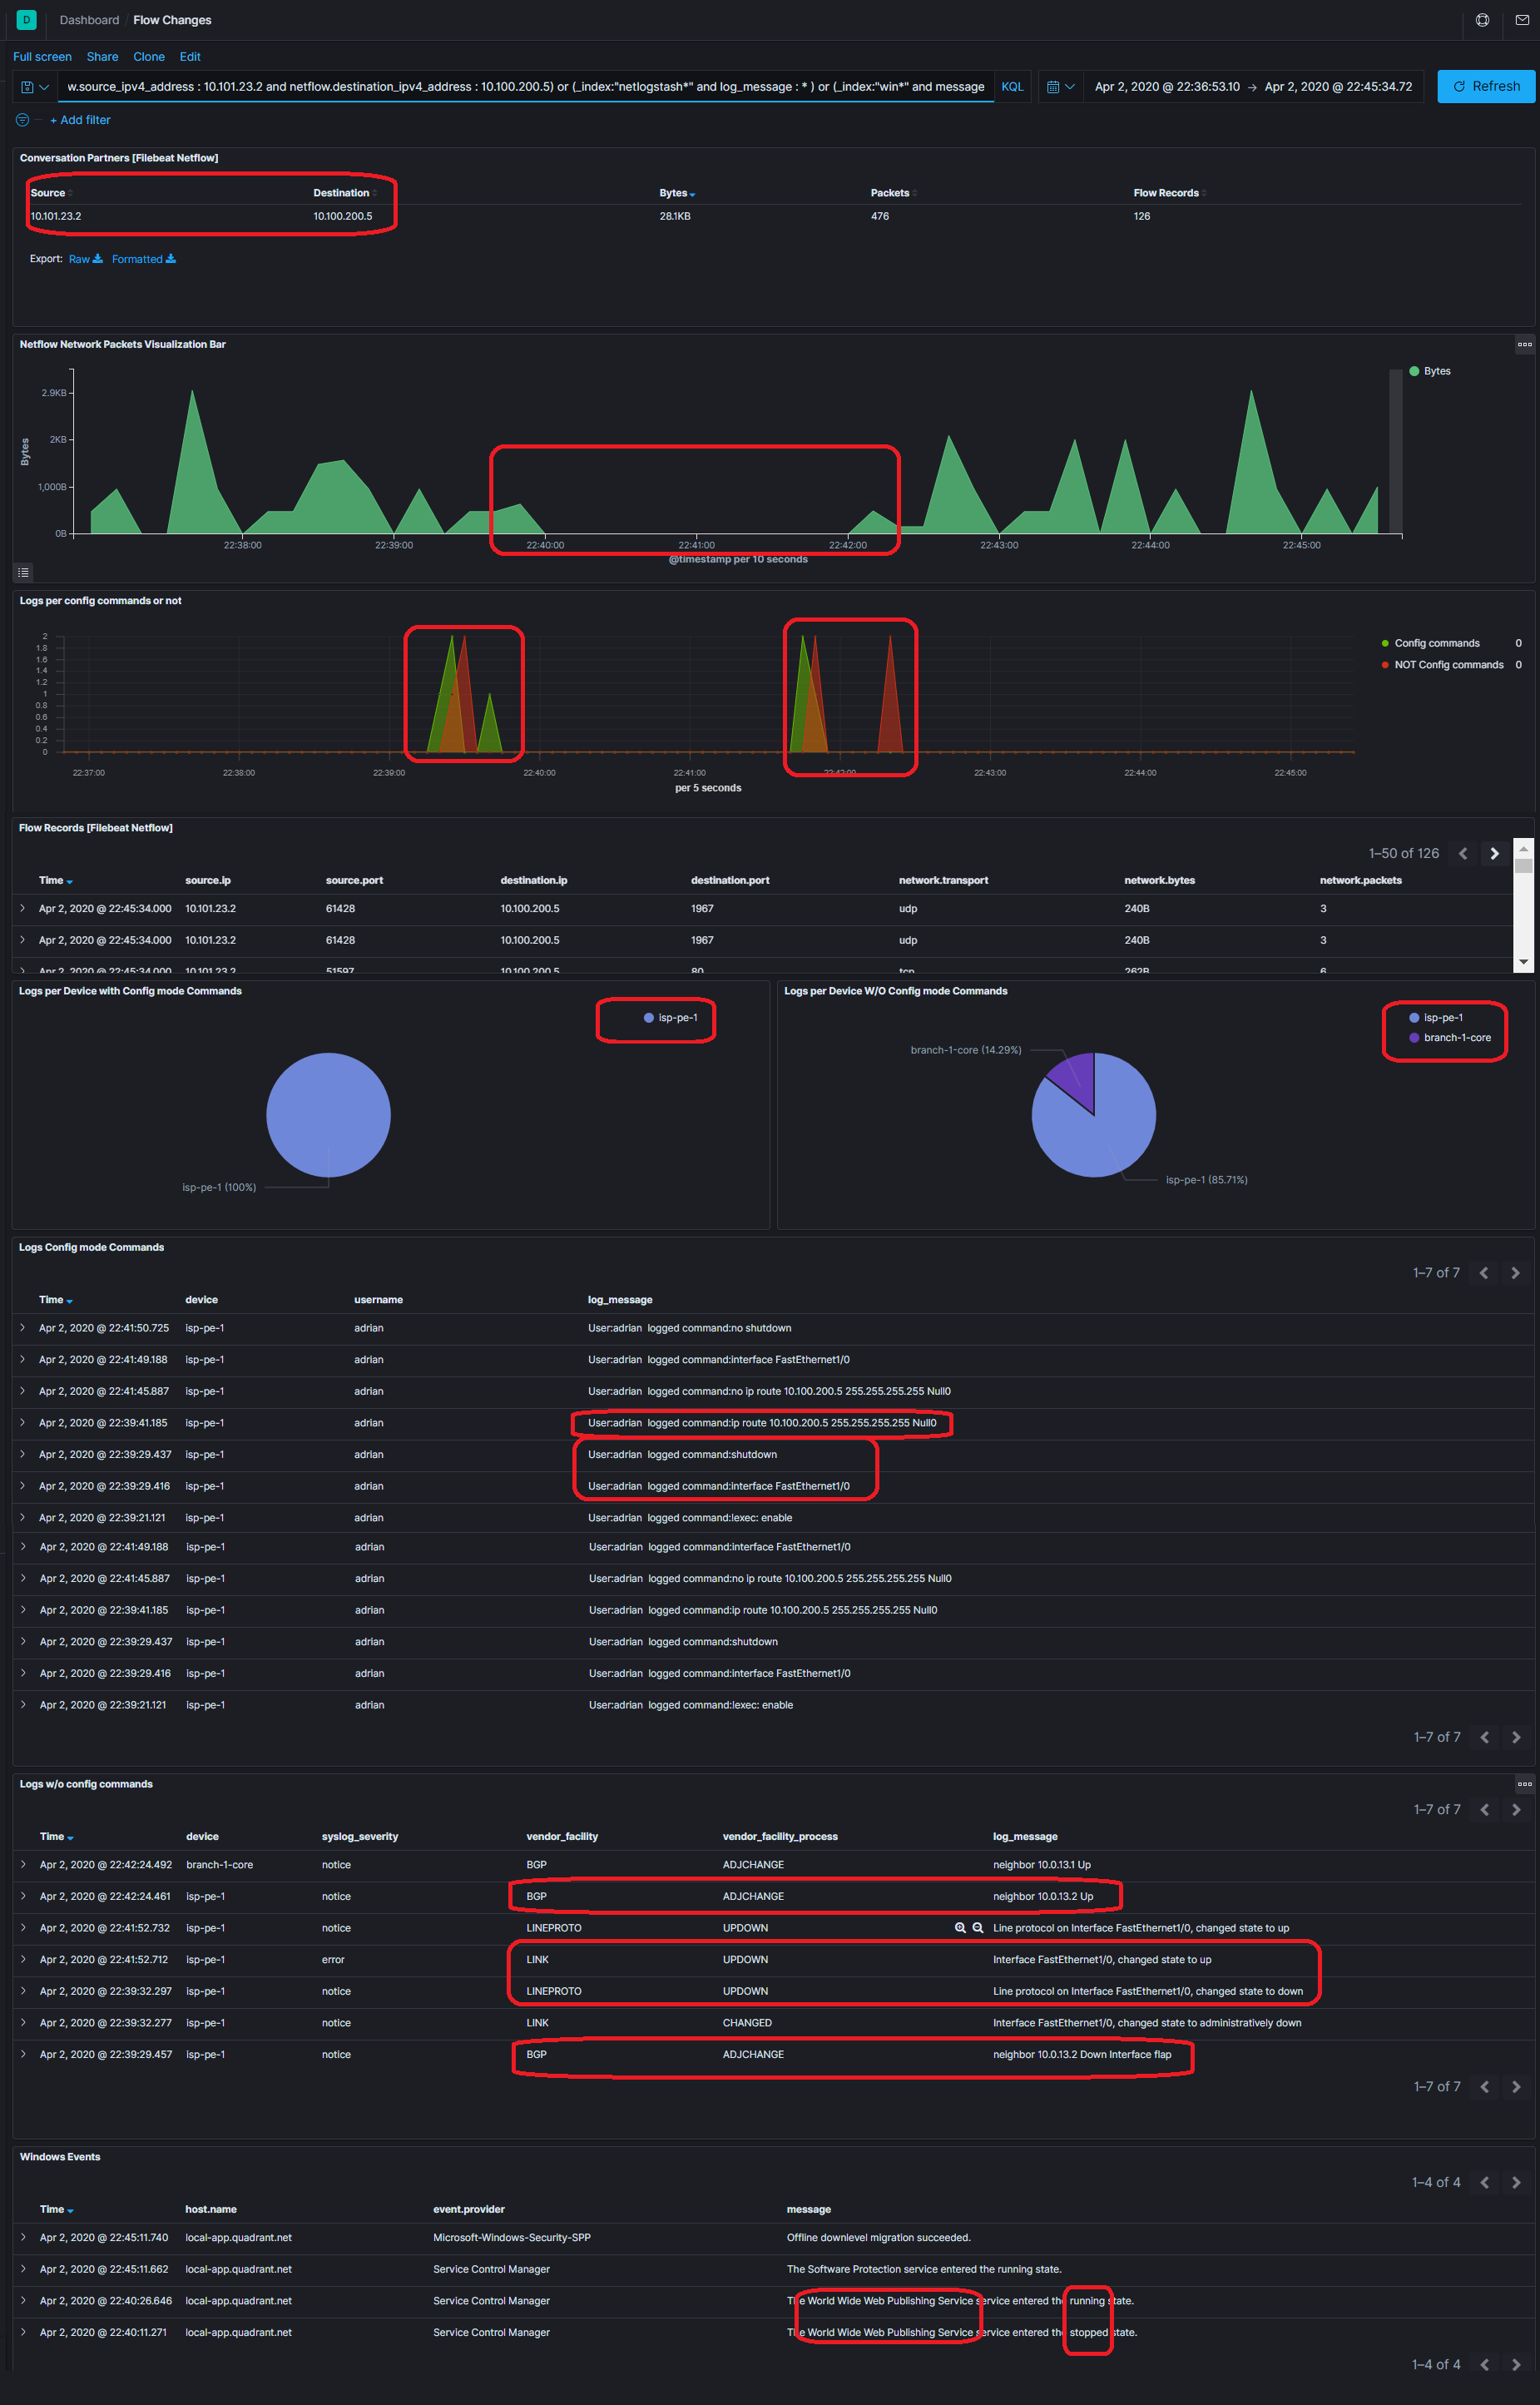
Amazing right? On only one screen you are correlating information about the network flows with rich information, network device logs, windows logs, and all the logs you can send to Elastic.
Windows Host Overview
And the last one, just in case there is a problem with the Windows Web Server. Check CPU, process, network, logs, etc.

Next steps? Get more metrics with SNMP and network latency maps.
Later, someday, since Elastic can correlate event/logs from any source, with all the information in one place, we could apply some other techniques like Machine Learning to prevent an incident. Instead of triggering emails with alerts, we could trigger automated actions to avoid getting to that incident.
Thanks for reading, I hope you enjoy this as much as I do. Cheers!