Unleashing the Power of NetDevOps: Simplifying Network Operations with Automation
Last year was an incredible journey with my network automation projects! I had the opportunity to simplify Network Operations and gain valuable visibility at a low cost by leveraging cloud services to run the code. Welcome to the world of NetDevOps!
This time around, I won’t give code details, but I’ll share some of the main ideas. Eureka!
Take your time reading because there’s a lot of valuable information here.
Previously, I worked at the Arch/L3 level, automating delivery processes and successfully debunking the myth that “networking is the bottleneck in new deployments.” But last year, I embraced an “automate everything” mindset and focused on pure Network Operations. The results were outstanding! I eliminated repetitive tasks, enhanced existing processes, and introduced new capabilities. It was a win for our operations team, we even handled 100% growth without a hitch!
One of the keys to success was integrating and reusing the tools already in use at the company. By simply adding my piece of work to integrate them, whether internal or cloud-based, and then focus on what truly mattered to us.
While my approach is custom-made and environment-specific, the ideas are adaptable to any setup. You don’t need to be a lifelong expert developer—I myself am a networking guy who learned automation and coding in the last few years. So, feel free to dive in and see how far you can go!
My previous posts highlighted what could be achieved using Slack, and now, I’ll add some more use cases. By merely using buttons, pop-ups, or dialog boxes I was able to get out of the box of networking and directly reach out even to non-IT users. I don’t need to develop and manage front-end servers, even no servers at all. And then just smoothly guide the users through Slack, which everyone knows how to use right? is just a chat and the whole company can use it.
Starting point
To begin the journey, I started with coding and automating basic 1st level troubleshooting tasks for problem analysis. Leveraging our SDN controller made things easier. Think about logs parsing, CPU/memory/resources usage, error counters, and latency. All of this could be handled in code, and then add logical conditions (e.g., “x > 80” and “y has an error” for the last 10 minutes) to generate alerts for specific scenarios and detect potential issues. Finally, I integrated the code into a Cloud Run container, and using a Slack chatbot as a secure and cost-effective front-end launcher for my automated pieces of code, I was able to check all the network variables in seconds.
Remember, building small pieces of reusable code is the way to go. It is the foundation for creating interactive “buttons” in Slack or embedding the code elsewhere. We even implemented a “panic button” for emergencies, which generates a ticket, and a Slack channel to get together the NetOps team and the user itself. This feature has been incredibly helpful in our remote-working setup, it enabled us to have quick and easy communication.
While this was a great starting point with some level of automation, I was eager to …
Make it even more automated…
Without requiring human intervention to launch the tests. So, I wrapped the code in a Cloud Function (or AWS Lambda), which is automatically triggered at set intervals or even based on logs. And behold, now you have a cost-effective monitoring platform! Eliminating the need for fancy but underutilized dashboards. All I wanted was informed alerts with extra logic, telling me what needed attention, and when.
Now, let me clarify, I’m not advocating replacing any vendor-specific tools. My goal is to enhance and integrate them with other tools our company uses. The magic lies in combining these forces to create something better. And so, I started sending Slack alerts for the same list of tasks mentioned earlier, now enhanced with additional logic. The result? The system itself runs all these checks in the background, producing alerts and logs that keep us on top of things. The monitoring code also opens and closes Jira tickets for the support team, based on metrics and logs, ensuring smooth operations.
Yet, I felt there was one more step to take. So, I added a dashboard to the Slack chatbot, becoming the main network status hub. Check out all the functionalities just here.
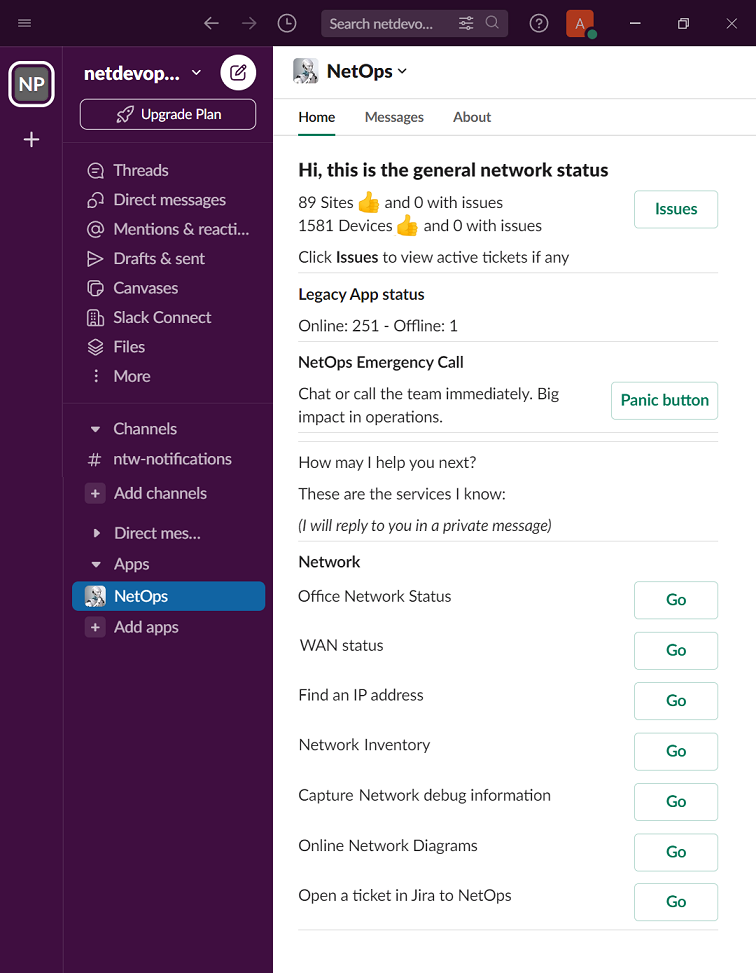
Please note that the previous picture is my NetOps menu. Other users have diverent options in the menu. And since this is a multinational company… the chatBot even speak 5 lenguajes 😉

Today, I can simply open Slack on my cellphone from anywhere, check the chatbot’s Home tab, and know if everything’s running smoothly. If there’s an issue, I’ve got a direct link to the Jira ticket to see what’s happening and who’s on the case.
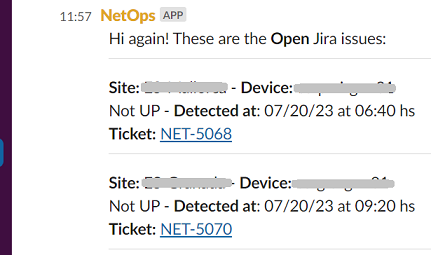
It’s like having my own network guardian and command center! From here I can see the network status and trigger automated actions (I’m not showing my full menu 😉 ).
Everyday a get an automated PDF report in my Slack with yesterday statistics, and every month the monthly one.

I have all the metrics literally in my hand everyday!
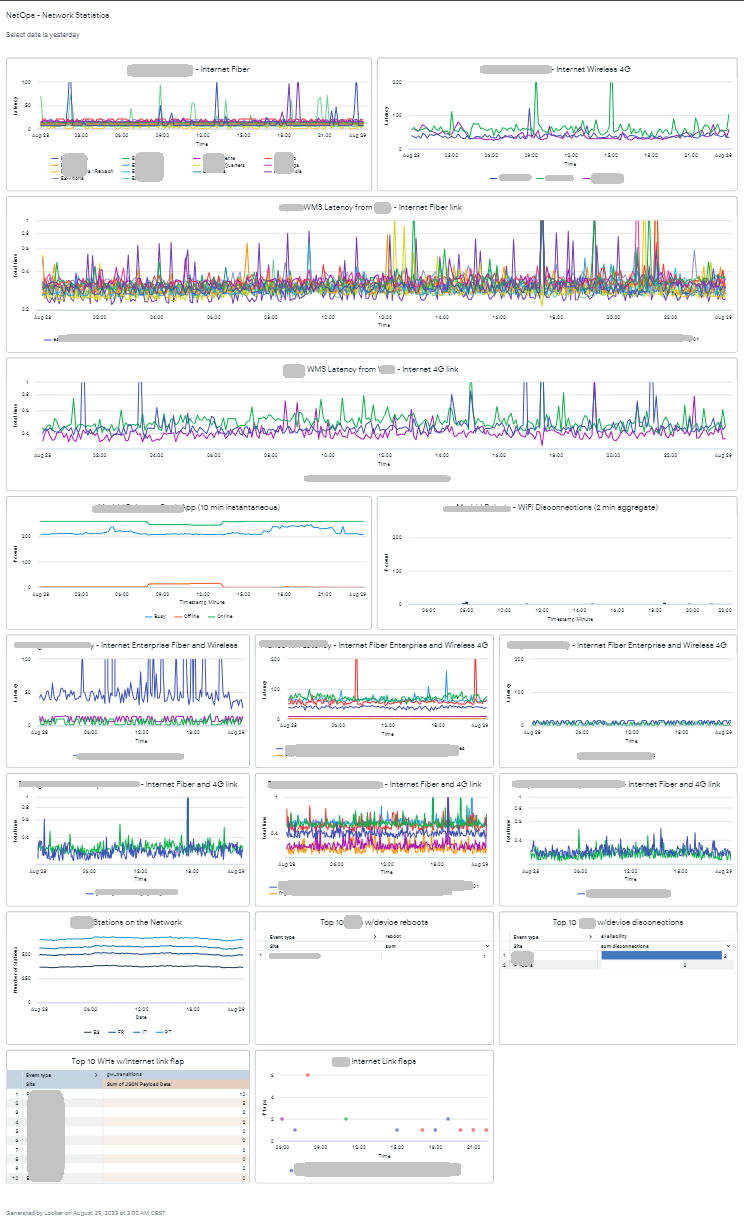
And you know what? I don’t manage 1 single server! I just have a small army of Cloud Functions and 1 Cloud Run doing all the work for me 🙂
The cost for this incredible setup is less than $7 a month. It’s fully customizable and your imagination is the only limit! I won’t deny that it requires some development time, but believe me, it’s worth every second. Is fun, and you’ll be performing these network tweaks sooner or later anyway.
Network growth and scale
As our company’s network continued to grow exponentially, the burden of manual procedures such as documentation and device onboarding became overwhelming. That’s where network automation became a savior for us. First I explored the tools available at the company to create a fully automated system seeking for integration and reuse. Keeping in mind that with each piece of information stored, I could make it accessible to our chatbot and other parts of our system that needed it.
Every night or event-based, my scripts run and update our device inventory, IP addressing, monitoring, and even network diagrams. Yes, automated diagrams! While they may not be as visually beautiful as the ones I used to create manually, it’s a small price to pay for the hours saved. Plus, when someone asks for diagrams or an audit comes around, I simply direct them to our Confluence page, where the diagrams are updated daily if not instantaneously.
Since the documentation is now automatically updated whenever there’s a network change, and then posting it to Confluence for human usage, we also have it in JSON format in a bucket for code usage. This automated documentation process saved valuable time and ensured up-to-date information was available anytime which led to significant gains in efficiency and scalability.
This automation also enables us to access online inventories, on-the-fly network diagrams, and even pinpoint the location of an IP in the infrastructure, whether on-prem or in the Cloud.
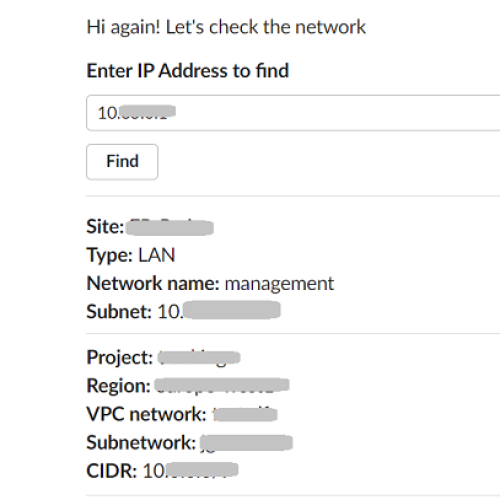
Both Confluence and the bucket provide a versioning system, crucial for traceability. So I don’t need to take care of that either. However, you could opt for any other output format and storage of your choice, be it Git, G-Drive, a shared folder, or even a simple spreadsheet. The magic lies in the updates each time we add new sites or devices.
Then, a couple of months later something interesting happened…
We extended our Network scope
Once our automation framework was in place, adding new functionality became a breeze. In this case, it was a legacy Web system that lacked proper monitoring. Despite having a dashboard, nobody paid much attention to it. With some coding, we managed to scrape essential data, and integrate it with our existing framework, resulting in chatbot alerts, Jira tickets, and nice graphics. And this leads me to the next topic…
Getting insights from the code logging
Because each time these pieces of code run, a custom log is generated. And by harnessing the power of GCP BigQuery and LookerStudio (tools that every cloud provider offers in their own way) to bring life to these logs, mixing and generating graphics and reports offered valuable insights. The flexibility of LookerStudio allowed me to create personalized reports, enabling us to prioritize improvements based on real-time data insights.
For instance, managing a big infrastructure became more straightforward as I generated tables and graphs showcasing the most vulnerable components.

With dynamic filtering by time, site, or any metric available from the logs, we could pinpoint areas that required attention and investment.

But here’s the best part, sorry I can’t stop saying it… I’m not managing any database or front-end graphics! These systems already take care of this, allowing me to focus on the magical orchestration and explore uncharted territories in this NetDevOps journey.
Next, I got creative again and made up a …
Custom application response time
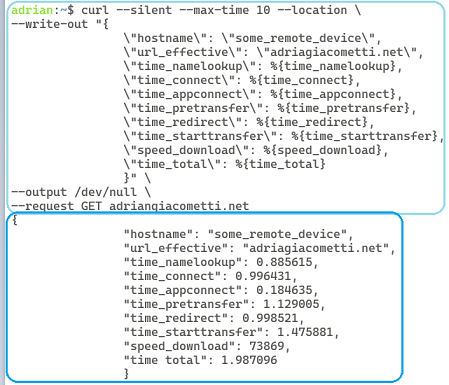
It’s not a traditional use case, but it proved to be quite insightful. By using cURL and cron task I emulated user experience and gather statistics on response time. By running this command and then posting the results to a simple Cloud Function to transform this data into logs, I was able to integrate this data into the platform, adding again alerts, tickets graphs, and analytics.
In conclusion, the path to NetDevOps success lies in empowering automation, reusing existing tools, and promoting a culture of continuous improvement. As you embrace these concepts, be prepared for remarkable results and endless possibilities.
Today as my NetDevOps journey continues, I’m thinking about my…
Next steps
Configuration compliance is certainly one area to explore, adding ingest of other information sources and implementing the same concepts and functions will become normal. And then Machine Learning (ML) and anomaly detection come to my mind, though it remains uncharted territory for me. But having so much data and statistics I can’t help thinking about it.
Thanks for reading and Happy NetDevOpsing! 😉